Tag: development

Save Bracket As Image

Our first new feature of 2025 allows you to save entire brackets to your device for usage outside of the Bracket Master app. Create the best-looking tournament brackets anywhere!
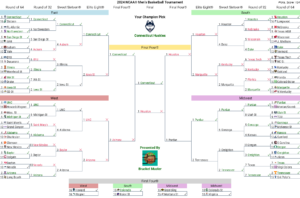
This functionality is provided from the Years tournament pages, the Picks page, and the Simulation page. Bracket images are saved as a standard ‘.png’ file and may be viewed using your pictures gallery, shared online, printed for examination in a larger format, or perhaps submitted to a bracket pool.

Tap on the Save Image ‘panorama image’ icon at the top right of the screen to
generate a picture of the entire bracket. When using this function from the Picks page, a bracket image will be generated showing your game selections with color-coding for correct and incorrect picks based on game results. The Years and Sim pages will show brackets displaying the score of official or simulated games, respectively.  Remember to Tap the Help ‘question mark’ icon for guidance on any of Bracket Masters pages.
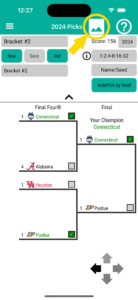


Tap the Save ‘floppy disk’ icon to save the bracket image to your device. The save location will default to the general user location of your device, though you can select a specific location using the save dialog. The image will be assigned a generated file name, though this may be changed using the save dialog, or from the Image Settings page (by tapping the gear icon). Use your device’s Files app to access the image after saving it. Using an Apple device, the bracket image won’t be accessible by the picture Gallery app unless you actively Share it to the pictures folder or an album using the Files app Share functions. Also use the Share function to text message or email the image. With an Android device, the bracket image will typically be automatically accessible by other apps, but if it isn’t the process is similar to that of Apple devices — use an Android file management app to Share the image with other apps or move it to another folder.
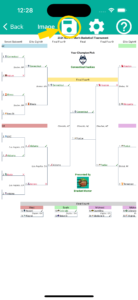
Tap the Settings ‘gear’ icon to modify the configuration of the image generation. The Image Settings page allows you to modify the bracket title line, the file name, and the optional appearance of logos, seed numbers, and game locations. See the Image Settings help page for more detail on these options.

Print your bracket image using ‘Landscape’ orientation and the ‘Shrink to Fit’ or ‘Scale to Fit’ option in your printer settings. Note that setting the display option for seed numbers and team logos to ‘All Rounds’ will cause the generated bracket to grow in width, so for tournaments with more than 32 teams the image will need to be scaled down to properly fit on a 8.5 x 11 inch or A4 piece of paper.

Tournament Update Schedule

Today, Thursday, March 14, 2024 at 12:50 EDT, we released the first ‘over-the-air’ database update to Bracket Master.  Download this by going to the app’s Settings Page and clicking on the ‘Check Now for Update’ button.  This updates the projected tournament bracket and includes team statistics for games through Wednesday.  As of this morning the following automatic qualifiers are now in the big dance: Stetson, Montana State, Longwood, College of Charleston, Oakland Michigan, Drake, Wagner, Morehead State, Colgate, Samford, McNeese State, and South Dakota State, James Madison, and Saint Mary’s.

Bracket Master will get another data update after the tournament selection show on Sunday night, followed by a full app update on Monday morning.

The Monday update will include a new feature: the ability to tag your favorite teams and have them appear at the top of the Teams front page listing.  Monday will also include the final regular season statistics and assorted functionality improvements.

As the tournament progresses, we plan to put out data updates the morning after the completion of each round.

Enjoy the tournament, everyone!  It should be a wild one.

Leap Day Major Update

Bracket Master is being updated today with its first functionality additions of the year. This release has been in the works since November and primarily comprises ‘under-the-hood’ improvements, but there are several new features included.

The app now includes several new well-regarded team rating metrics. Also, our exclusive Scrutinous Score has been refined and given more visibility in the app. We believe the enhanced Scrutinous Score and Scrutinous Game Odds have significantly improved our (already very successful) tournament game picks and simulation.

A Compare Teams function has been added to the top-level menu. This allows you to view side-by-side statistics of any two teams from any season. This feature was previously available through the Picks Page to contrast teams in a scheduled matchup, but this new option gives much more flexibility.

A Settings page has been added to the top-level menu. This allows you to set a Dark Theme or Light Theme display. Additionally, the ability to update the app’s data is provided. Clicking on the ‘Check for Data Update’ button will query the internet for a data file refresh. This is a database file provided by Scrutinous, so an update won’t always be available, but this function should allow us to deliver more frequent data refreshes to you. When an update is available via your app store, you likely will not be able to update using this option.

All of the team and conference logos have been refreshed and hopefully improved.  Some of the images don’t look great while using Dark Mode, so we’ll try to revise them over time.

This Bracket Master version 1.4.1 update is essentially a full re-write of the app. The new code base should improve performance, polish the app’s appearance, better support the delivery of new features, and sustain the app over the long term. Stay tuned for more big enhancements coming this year.

If you encounter a bug, please describe it on our Report a Bug forum. We welcome suggestions for new functionality on our Request a Feature forum.

The Cinderella Score: PTP

Bracket Master’s latest new feature is the Performance Page.  This page allows you to examine the tournament performance of Teams and Conferences compared to expectations.  The exclusive PTP© score presented here evaluates tournament advancement relative to the designated seed number.  PTP© is an initialism of Performance to Par.

PTP defines a seed’s expected performance par by assuming that the higher seed should always win, i.e., game results are determined by ‘chalk’.  If one works through a bracket picking the higher seed in every game, the following results unfold:

  • 1 seeds are meant to reach the Final Four
  • 2 seeds are presumed to reach the Elite Eight
  • 3s & 4s should make the Sweet Sixteen
  • 4s through 8s should win one game into the Round of 32
  • 9s through 16 aren’t expected to win a game.

PTP assigns a score based on these expectations.  For each game a team advances past their seed number’s expected round the team earns one point; each round the team fall short they lose one point.  For example, in 2022 the championship Kansas team (#1 seed) earned two points for winning two games beyond reaching the Final Four.  Saint Peter’s (#15 seed) earned a +3 for winning three games; their first round opponent, Kentucky (#2 seed), gets a -3 for not making their forecasted Elite Eight.

Accumulating a large positive score is challenging for high-major teams that consistently receive top seed bids because of how hard it is to advance deep in the tournament.  To help account for this, we display the Average Seed of each team alongside their PTP.  A lower (better) Avg Seed means the team was anticipated to win multiple games.  A positive PTP score over time with a low Average Seed is particularly impressive.

The challenge for highly seeded teams is contrasted by mid-major Cinderellas such as the Loyola Ramblers.  Their 2018 run as an eleven seed banked themselves +4 PTP.

We feel that the PTP listing of Conferences is particularly useful.  It lessens the bias of small sample sizes to illuminate the leagues that produce title contenders and dark horses, and those that have perhaps become over-rated for a span.

The PTP score helps to remind of the biggest shocks in tournament history, such as DePaul’s collapses as a #1 seed from 1980 to 1984, and Butler’s run to the finals in 2010 and 2011.  The DePaul years are described in the following article: The Bonus: March 14, 1981: When the NCAA tournament became Madness – Sports Illustrated.  Butler is said to be the smallest university to play in the championship game since the 1985 64-team field.  Their 2010 tournament is detailed here: Butler’s incredible 2010 NCAA run, remembered by Coach K, Tom Izzo, Frank Martin and Jim Boeheim | NCAA.com

The Performance Page featuring the PTP score is part of the BracketMaster 1.3.6 release of February 27, 2023.

Introducing the BEST

Bracket Master’s first new feature of 2023 is the Trends Page.  This page allows you to examine the consolidated tournament achievements of Teams and Conferences over a user-specified period of time.  The exclusive BEST© score presented here intends to identify the top entities over an extended period of time by tallying tournament victories, weighted by their advancement in the championship.  BEST is an acronym for BracketMaster Elite Season Trend.  The calculation of BEST is based on the following terms:

BEST© Achievement Points

  • 16 => Won Championship
  • 12 => Lost in Finals
  • 9 => Lost in Final Four
  • 6 => Lost in Elite Eight
  • 4 => Lost in Sweet Sixteen
  • 2 => Lost in Round of 32
  • 1 => Lost in Round of 64/First Four

This scoring system seeks to reward repeated deep runs without overemphasizing championship victories.  Tournaments in years prior to the 64-plus-team field (introduced in 1985) award the same number of points for championships, final fours, etc; those years just  don’t provide points for early, partial rounds.  For example, 1984 champ Georgetown earned 16 points, and first full-round (Round of 32) loser UTEP earned 2 points for making the tournament, but not winning any games.  Similarly, the 1939 tournament with just an eight team field awards 16 points for a championship and 6 points for a first game loss.

BEST also provides an optional weighting factor in order to emphasize more recent performance over that of the distant past.  Seasons of increasing time into the past have their achievement points reduced by a shrinking percentage factor.  BEST uses a 3rd degree polynomial to calculate the weighting factor, with more recent seasons slowly reducing in percentage, seasons after 20 years more rapidly falling, and then leveling out after 50 years in the past.  In terms of specific points, the weighting equation provides a 94% multiplier at 10 years, sliding to 67% at 30 years, 50% at 50 years, and bottoms out at 35% at 80 years.  The most recent five tournaments are always weighted at 100%.  The ability to disable this factor eases comparisons between different spans of time.

BEST can be calculated for the entire history of the college basketball tournament, but it also allows one to examine interesting questions, such as: who was the top team of the 1980s, or: what has been the most successful conference of the 21st century.

Thanks go out to user “Brewer” for suggesting the framework of this rating.  You can suggest your own idea for a new feature on our forum: scrutinous.net/forums/forum/request-a-feature/.

The Trends Page featuring the BEST score is part of the BracketMaster App 1.3.3 release of January 17, 2023.

Future Development

Your continued support of BracketMaster will encourage us toward making it even better.  Below are some of the ideas we have for future enhancements.

  • “Create your own Bracket” is a much requested feature that we are investigating.  The mobile interface makes it a challenge to efficiently enter teams, but we are looking into possibilities.
  • Add Conference Record by Round.  For example, the Big East is 9-4 in Final Round games.  This data can be obtained using the Game Search Page, but it might be useful to provide a dedicated space for it.
  • Analysis of winning percentage based on the teams’ distance traveled.  Update: As of release 1.2.7, travel distance is considered in the calculation of Scrutinous Odds used for that auto-pick method and for the simulation engine.  Game travel distance is displayed on the Team Comparison Page, shown when you tap on a team on the Picks Page.
  • Additional team ratings and statistics.  Update: In release 1.2.1, all division 1 team seasons since 1998 were added.  Previously, we only included team seasons of schools that made the tournament.  Additionally, Strength of Schedule (SoS), and the Bart Torvik Power Rating were added to the team pages.
  • Separate the Conference Teams Page into sections for current and past members.  Update: Added in release 1.2.1.  Also added the conference record for all their tournament seasons.
  • Present a search function to view a list of games that meet certain criteria.  For example, all games between #8 and #9 seeds, games between Big Ten and ACC teams, etc.  Update: Added in release 1.2.3.  A consolidated results option may be implemented in the future.
  • Furnish a dark themed interface and allow users to select their preferred theme.
  • Possibly provide a font size adjustment setting.
  • Possibly offer a paid ad-free version.
  • Possibly support other languages (with assistance from the community).
  • Build an app focused on the Women’s National Collegiate Championship.

We’d love to hear your thoughts as well — the best way for you to provide this feedback is on our Request a Feature community forum.  If you would like to monetarily support our future development you can contribute through our About page.  Thank you!